Logviewer
This is the screen you use while the charger is actually running.
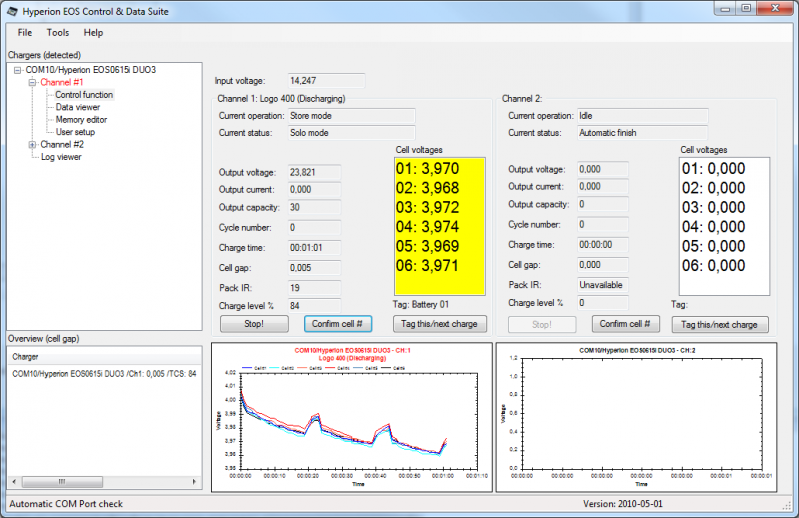
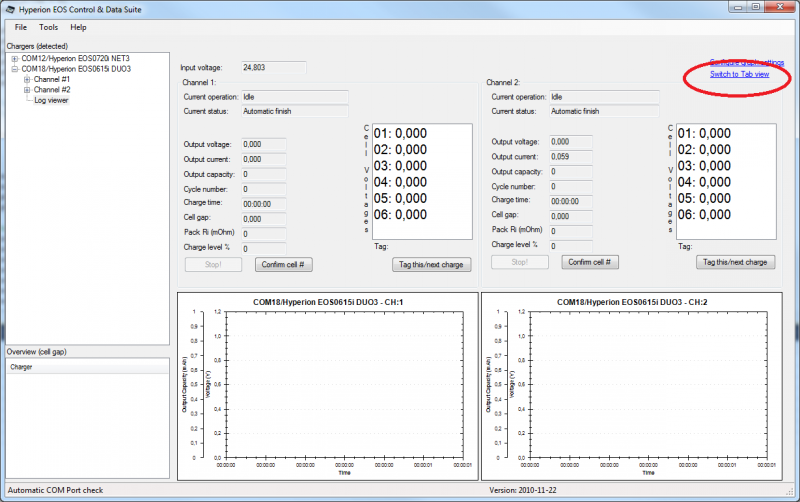
The logviewer (in this case showing 2 channels), shows you a total overview of each channel that is connected.
Note: When viewing a networked 0720iNET setup, if you charge in sync mode both channels will show in a single screen (regardless of what charger you select out of the two that is networked.)
If a charge is active you will have the Stop Charge button enabled. This does not apply for those chargers that are unable to be controlled from the software. See Before you start.
The Confirm Cell # button is the same as pressing Enter on the LCD of the charger, either to speed up the charge start process or to confirm cell count if no balancer is used.
When a charger is active the current channel is highlighted in green, red or blue in the main treeview window depending on whether it is charging, discharging or waiting.
The Tag this/next charge button will open a free text dialog box
The logviewer stores all the logged information to a SQL Database (sqlite), so you can run external statistics on the chargers at a later stage, all cell voltages are included as well as the tagging. It is also possible to export from the database in XML format.
You can at any time rightclick on a graph to save it or do other things, like Zoom which brings up the graph in a bigger window. Zooming is also available by dragging the cursor over the section you want to enlarge.
The logview scales, so if you want a bigger graph or bigger text in the cell voltage screen, maximize the screen.
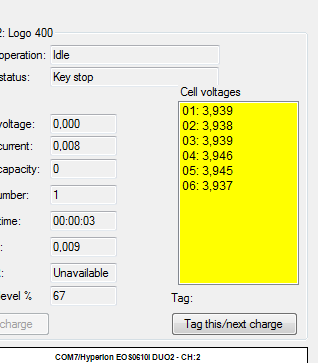
The Cell voltages screen turns yellow to indicate you have connected a pack with a balance connector , so you can easily identify which channel is which in a multi-channel setup.
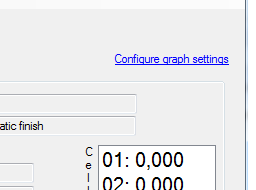
As of version 2010-06-02 you can find a configure graph link in the upper right corner
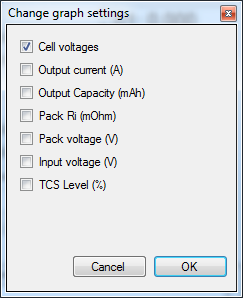
When you press that link you get a selection box of what fields to show in the graph.
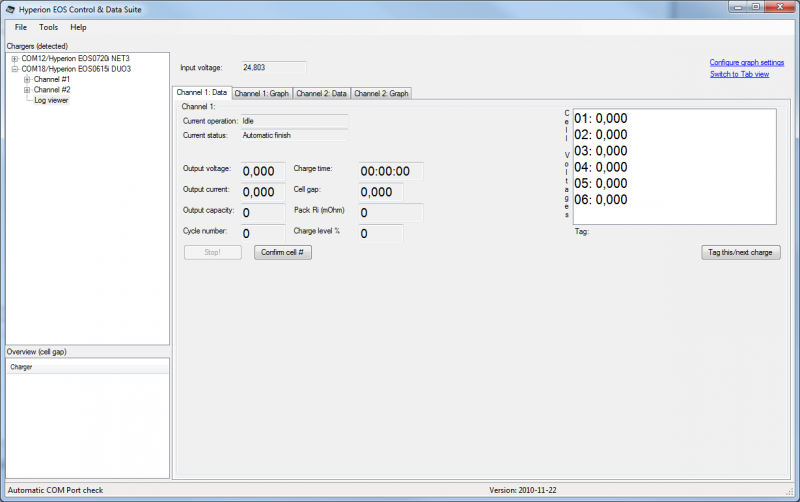
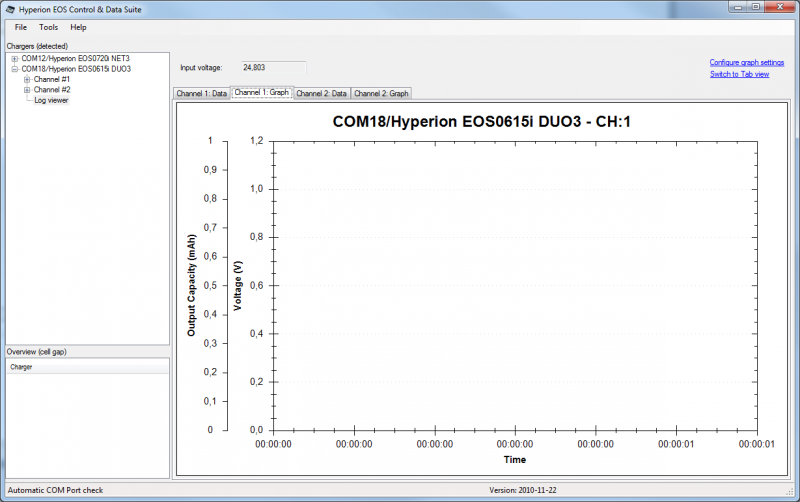
v2010-12-06: There is a new View on the Logviewer where you can see each channel's data and graph in Tabs, to access this press the "Switch to Tab view" link.
This will give you the following screens instead;
You can switch back to normal view any time by pressing the same link.
|
