The Main Screen
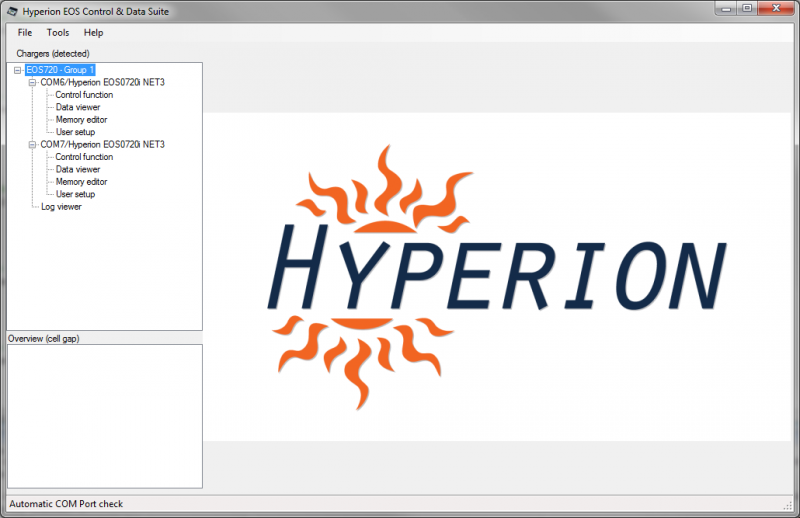
The Main Screen is where the software first starts. The File menu on this screen is the place to select Exit to close the software. Note that the software automatically checks for a new version at startup. If you start then instantly press X from Windows to exit, the software may appear to freeze until the checking process is complete.
Charger detection
When the software starts, your Charger should appear in the Chargers (detected) box in the top LH corner. If not, then go to the File menu and select Re–Initialize chargers (run startup again) AFTER you restart the charger and connect/disconnect the USB. If this does not find the charger, then you have a COM port issue. See “Troubleshooting” in this help about checking which COM port your computer is using and then see Manual COM Port selection if automatic doesn’t work. You use Manual COM port selection in the File menu to select a COM port if necessary.
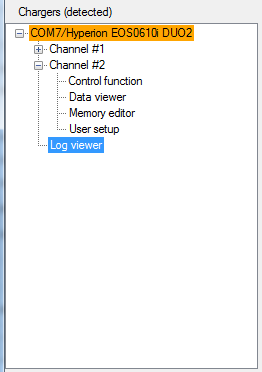
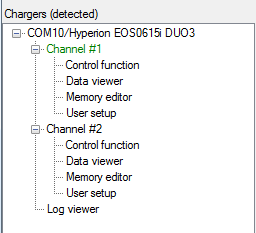
The example below is typical. In the Top Left hand side box you have a list of chargers with all the functions the software has for each. A Duo charger will show as a single entry with each channel listed underneath it. Click on the + sign to expand the two channels of a Duo and click on the + sign for each channel to get the functions. A non-duo like the 720iNET, even if networked, will show as a single charger. The example below shows two EOS 0720i NET3 chargers connected. One is on COM 6 and one on COM7. A Duo charger will have a similar display but uses only the one COM port. If you have more then one charger, please read this before starting. Note that you can Right Click to change the name of the charger from the default. See Configure Alarms in this help for an example of where this is useful.
The bottom menu Log viewer takes you to the display screen that is the normal one you use when the charger is running. The screen will switch to the Logview automatically when a charge/discharge starts. Logview shows the voltage of every cell in a different color graphed against elapsed time. For cells 8-14 on the EOS1410 the lines are dotted.

The Bottom Left Hand side box has an overview of critical information for all chargers that are connected and running.
For example it will show cell voltage gap (color coded black/green/yellow/red for severity in 10mV steps) and TCS%.
In the mainscreen, if a charger looses the connection to the software for some reason, after 5 seconds it will turn Orange, and look like this;

When connection is restored, the text will return to normal again.
When a charge or discharge is running, the active channel text (or channels if multichannel) will turn Green for Charging, Red for discharging and Blue for unknown for the time before it knows which direction, like this:

The other main menu is Tools. It is divided into two.
Here you can configure the various alarms, including setting the text that the computer will use to announce charger events.

See - Alarms, Set alarm for different type of events.
You can also see a quickview of the database where every piece of sampled data is stored, filtered to show only a single pack if required.
There is more information at Database quickView (show a quickview of the logging database).
The last item in the top half is the menu which allows you to set up two chargers as a single pair (you need a separate USB connection for each) and control them as one. See Charger pairing.
The bottom part of the window has some less-used functions:
Most importantly, access to the database under Charge Statistics. Here you can view the whole history of the software in use, filter by packname or any tags you have set, delete any unwanted records, and export selected charge records in XML format which can be read by many other programs, usefully the Microsoft Office suite and iWorks. The View Details button will take you to a window where you can select several useful graphs of Pack and Cell Voltage, IR and TCS level for any record in the database.
In Charge Statistics, if you are using a Duo to Synch Charge, the Channel 2 statistics are displayed in Blue and if no specific tag is entered for Channel 2 the tag from Channel 1 is used.
| 
